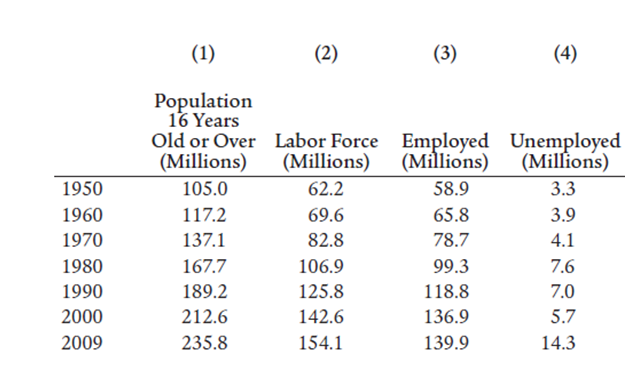
Figure 22.1
-Using Figure 22.1 calcuulate the unemployment rate in each of the years between 1950 and 2009.
Correct Answer:
Verified
The unemployment rate is calc...
View Answer
Unlock this answer now
Get Access to more Verified Answers free of charge
Q9: Assume a population of 3,000,000 people, 500,000
Q10: How does the Bureau of Labor Statistics
Q11: Suppose there are 10 million unemployed out
Q12: Some countries use claims for unemployment compensation
Q13: Explain how it might be possible for
Q15: Explain how it might be possible for
Q16: Table 7.2 Q17: Assume the number of people employed is Q18: Explain how and why the unemployment rate Q19:
![]()
![]()
Unlock this Answer For Free Now!
View this answer and more for free by performing one of the following actions

Scan the QR code to install the App and get 2 free unlocks

Unlock quizzes for free by uploading documents