 Figure 27.1
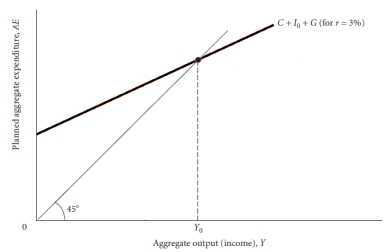
-Use Figure 27.1 above to answer the following question. Assume that the aggregate expenditure function depicted in the graph is based on an interest rate of 3%. Now assume that the interest rate rises to let's say 6%. Graphically illustrate the impact that this will have on the aggregate expenditure function and equilibrium output. Explain your answer.
Correct Answer:
Verified
View Answer
Unlock this answer now
Get Access to more Verified Answers free of charge
Q23: Q33: What action could the Fed take to Q34: The size of the crowding-out effect, affecting Q36: Explain how the crowding out effect can Q37: What are the two primary things on![]()
Unlock this Answer For Free Now!
View this answer and more for free by performing one of the following actions

Scan the QR code to install the App and get 2 free unlocks

Unlock quizzes for free by uploading documents