Monetary and Fiscal Policy Effects
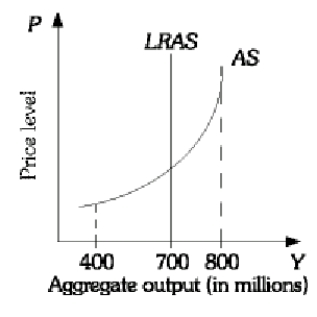
-Using the above graph, how would you characterize an output level of $800 million?
Correct Answer:
Verified
View Answer
Unlock this answer now
Get Access to more Verified Answers free of charge
Q27: Why will the price level tend to
Q28: Explain why the aggregate supply curve is
Q29: Explain how economic decline can happen as
Q30: Graphically illustrate and explain the aggregate supply
Q31: Illustrate what happens to the aggregate supply
Q33: At what point might the aggregate supply
Q34: Explain why it is not realistic to
Q35: Illustrate the effects of an increase in
Q36: Discuss why the aggregate supply function is
Q37: Why is the short-run aggregate supply curve
Unlock this Answer For Free Now!
View this answer and more for free by performing one of the following actions

Scan the QR code to install the App and get 2 free unlocks

Unlock quizzes for free by uploading documents