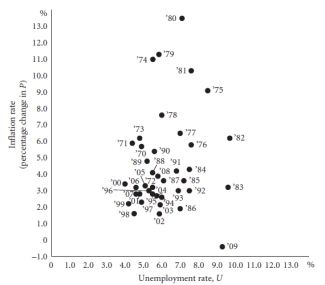
-The graph above plots unemployment rates and inflations rates from the time period between 1970 and 2009. What does this empirical evidence seem to suggest about the Phillips curve?
Correct Answer:
Verified
View Answer
Unlock this answer now
Get Access to more Verified Answers free of charge
Q84: Define what economists mean by the term
Q85: What is potential GDP?
Q86: For each of the following indicate if
Q87: If the AD curve shifts from year
Q88: Q90: Define the natural rate of unemployment. Q91: How do changes in expectations cause the Q92: Explain how expectations can be self-fulfilling in Q93: Explain how inflationary expectations affect the Phillips Q94: ![]()
![]()
Unlock this Answer For Free Now!
View this answer and more for free by performing one of the following actions

Scan the QR code to install the App and get 2 free unlocks

Unlock quizzes for free by uploading documents