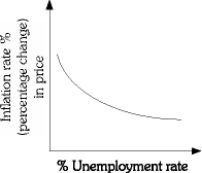
Define the Phillips Curve. Graphically illustrate the relationship between the inflation rate and the unemployment rate.
Correct Answer:
Verified
View Answer
Unlock this answer now
Get Access to more Verified Answers free of charge
Q78: Draw a graph of the Phillips Curve.
Q79: Explain what role expectations play in determining
Q80: If the economy experiences both inflation and
Q81: Why was the Phillips Curve relatively stable
Q82: Q84: Define what economists mean by the term Q85: What is potential GDP? Q86: For each of the following indicate if Q87: If the AD curve shifts from year Q88: ![]()
![]()
Unlock this Answer For Free Now!
View this answer and more for free by performing one of the following actions

Scan the QR code to install the App and get 2 free unlocks

Unlock quizzes for free by uploading documents