Multiple Choice
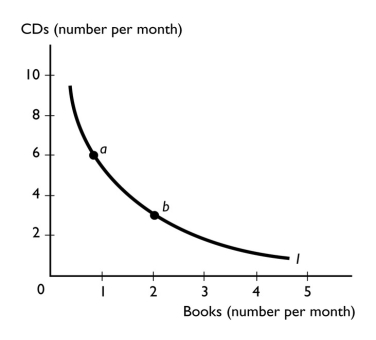
-The above figure shows one of Cheri's indifference curves.Suppose point a represents the best affordable point for Cheri.Cheri's best affordable point could move to point b if
A) marginal utility increases.
B) total utility increases.
C) the price of a CD falls and the price of a book rises.
D) the price of a CD rises and the price of a book falls.
E) Cheri's budget increases.
Correct Answer:
Verified
Related Questions
Q218: At the point where the budget line
Q219: In an indifference curve/budget line diagram,generally when
Q220: The indifference curve/budget line diagram concludes that
Q222: To derive a demand curve using the

