The Deepwater Horizon oil spill in the Gulf of Mexico which began from an explosion on April 20, 2010 resulted in a ban on shrimp fishing that measures about 10% of the Gulf. Using the graph below assume that the original supply curve before the spill is represented by So and the new supply curve is represented by S2 explain the process that takes place to reach a new equilibrium.
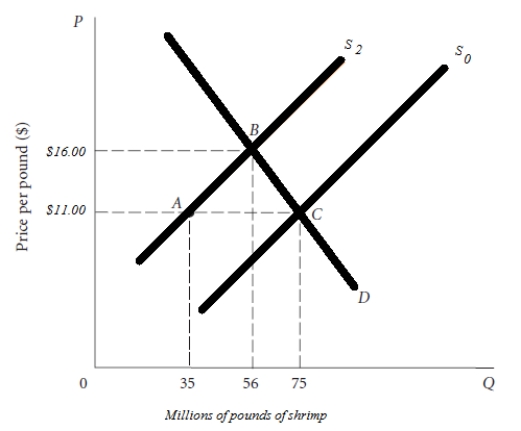 The supply curve shifts to the left. Before the waters are closed, the shrimp market is in equilibrium at the price of $11.00 and a quantity of 75 million pounds. The decreased supply of shrimp leads to higher prices, and a new equilibrium is reached at $16.00 and 56 million pounds (point
B).
Correct Answer:
Verified
View Answer
Unlock this answer now
Get Access to more Verified Answers free of charge
Q3: Assume that the cost of producing a
Q4: Explain how low-skilled workers might actually be
Q5: Colleges and universities often do not pay
Q6: Why is it that people who have
Q7: Most modern countries have prohibitions on the
Q9: Assume that the government of the state
Q10: Consumers are often bewildered by the different
Q11: Explain how the price system eliminates a
Q12: Assume that the original manuscript of Adam
Q13: What two important functions are performed by
Unlock this Answer For Free Now!
View this answer and more for free by performing one of the following actions

Scan the QR code to install the App and get 2 free unlocks

Unlock quizzes for free by uploading documents