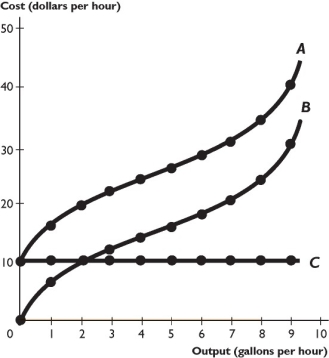
The figure above shows some of a firm's cost curves.
-Based on the figure above,curve A is the firm's
A) marginal cost curve.
B) total cost curve.
C) average total cost curve.
D) total variable cost curve.
E) total fixed cost curve.
Correct Answer:
Verified
Q203: Q204: If a company triples its output and Q205: Economies of scale and diseconomies of scale Q206: In the long run,constant returns to scale Q207: Consider a Wal-Mart supercenter and a 7-Eleven Q209: A firm's long-run average cost curve shows Q210: When the long-run average cost curve is Q211: The main source of economies of scale![]()
Unlock this Answer For Free Now!
View this answer and more for free by performing one of the following actions

Scan the QR code to install the App and get 2 free unlocks

Unlock quizzes for free by uploading documents