Multiple Choice
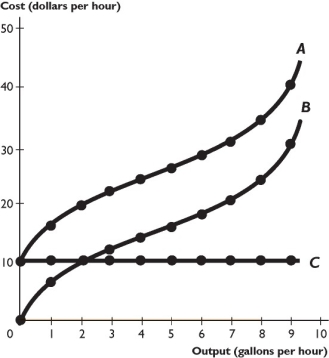
The figure above shows some of a firm's cost curves.
-Based on the figure above,curve B is the firm's
A) marginal cost curve.
B) total cost curve.
C) average total cost curve.
D) total variable cost curve.
E) total fixed cost curve.
Correct Answer:
Verified
Related Questions
Q196: Which of the following is true in
Q197: When a firm's long-run average total cost
Q198: A firm decreases its scale of operation
Q199: When a firm becomes so large it
Q200: If a firm increases its output and
Q202: The long-run average cost curve is U-shaped
Unlock this Answer For Free Now!
View this answer and more for free by performing one of the following actions

Scan the QR code to install the App and get 2 free unlocks

Unlock quizzes for free by uploading documents