Refer to the information provided in Figure 13.4 below to answer the questions that follow. 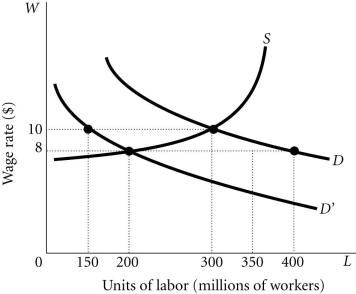 Figure 13.4
-Refer to Figure 13.4. Suppose there is an increase in the fertility rate and this causes some men and women to place a higher value on their time spent in non-market activities. This will cause
A) the labor supply curve to shift to the left of S.
B) the labor supply curve to shift to the right of S.
C) the labor demand curve to shift from D to D'.
D) the labor demand curve to shift from D' to D.
Correct Answer:
Verified
Q152: Refer to the information provided in Figure
Q153: Refer to the information provided in Figure
Q154: Suppose the wage rate in the labor
Q155: Even though explicit contracts may lead to
Q156: Workers in the textile industry are laid
Q158: The percentage of workers whose wages are
Q159: If wages are sticky, a decrease in
Q160: Refer to the information provided in Figure
Q161: Suppose that workers in the food service
Q162: Suppose that during a recession, Whirlpool saw
Unlock this Answer For Free Now!
View this answer and more for free by performing one of the following actions

Scan the QR code to install the App and get 2 free unlocks

Unlock quizzes for free by uploading documents