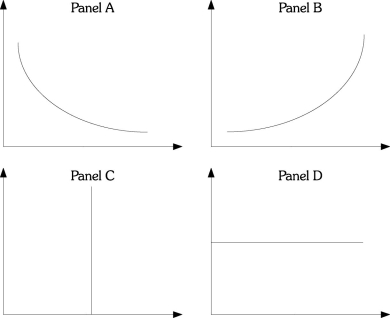
Refer to the information provided in Figure 13.6 below to answer the questions that follow.  Figure 13.6
-Refer to Figure 13.6. Panel C represents the typical shape of the
A) short-run Phillips curve.
B) long-run Phillips curve.
C) short-run aggregate supply curve.
D) short-run aggregate demand curve.
Correct Answer:
Verified
Q193: The Phillips curve depicts the relationship between
A)
Q194: As the unemployment rate increases in response
Q195: Refer to the information provided in Figure
Q196: Refer to the information provided in Figure
Q197: Refer to the information provided in Figure
Q199: Refer to the information provided in Figure
Q200: Refer to the information provided in Figure
Q201: If aggregate demand increases and expectations regarding
Q202: Refer to the information provided in Figure
Q203: Refer to the information provided in Figure
Unlock this Answer For Free Now!
View this answer and more for free by performing one of the following actions

Scan the QR code to install the App and get 2 free unlocks

Unlock quizzes for free by uploading documents