Refer to the information provided in Figure 8.5 below to answer the questions that follow. 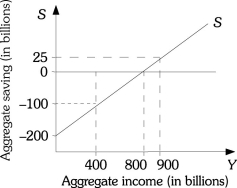 Figure 8.5
-Refer to Figure 8.5. In this graph, 0.25 represents this society's
A) MPC.
B) MPS.
C) saving function.
D) consumption function.
Correct Answer:
Verified
Q85: Refer to the information provided in Figure
Q86: Refer to the information provided in Figure
Q87: Refer to the information provided in Figure
Q88: Refer to the information provided in Figure
Q89: Refer to the information provided in Figure
Q91: Refer to the information provided in Figure
Q92: Refer to the information provided in Figure
Q93: Refer to the information provided in Figure
Q94: Refer to the information provided in Figure
Q95: Refer to the information provided in Figure
Unlock this Answer For Free Now!
View this answer and more for free by performing one of the following actions

Scan the QR code to install the App and get 2 free unlocks

Unlock quizzes for free by uploading documents