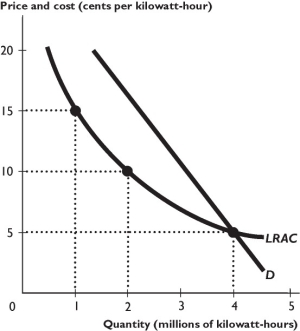
The figure above shows a firm's demand and average total cost curves.
-The situation in the figure above creates a barrier to entry for a second firm because
i.a second firm that produced as many kilowatt-hours as the first firm would see the market price fall beneath its cost and would incur an economic loss.
ii.a second firm that produced fewer kilowatt-hours than the first firm would have to charge a higher price and would not gain many customers.
iii.the first firm's average total cost curve indicates it has been given a patent for the product.
A) i only
B) ii only
C) iii only
D) i and ii
E) i and iii
Correct Answer:
Verified
Q284: Under earnings-sharing regulation,if a firm's profits _
Q285: Q286: If a natural monopoly is told to Q287: Q288: Which of the following best describes the Q290: Q291: At a level of output when regulators Q292: Earning-sharing regulation involves Q293: Price cap regulation Q294: Unlock this Answer For Free Now! View this answer and more for free by performing one of the following actions Scan the QR code to install the App and get 2 free unlocks Unlock quizzes for free by uploading documents![]()
![]()
![]()
A) setting the monopoly's price
A) does not provide incentives![]()

