Multiple Choice

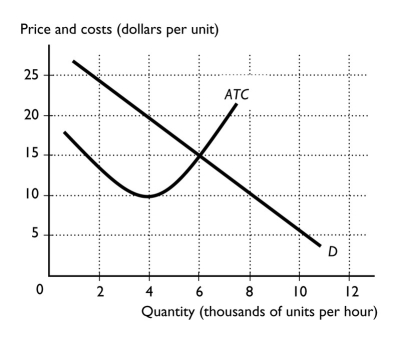
-The figure above shows the market demand curve and the ATC curve for a firm.If all firms in the market have the same ATC curve,the figure shows a ________ can profitably operate.
A) natural monopoly in which 1 firm
B) natural monopoly in which 2 firms
C) natural oligopoly in which 3 firms
D) natural oligopoly in which 2 firms
E) natural oligopoly in which 8 firms
Correct Answer:
Verified
Related Questions
Q29: Q30: Collusion results when a group of firms Q31: A cartel is a group of firms Q32: A market with only two firms is![]()
i.act
A)

