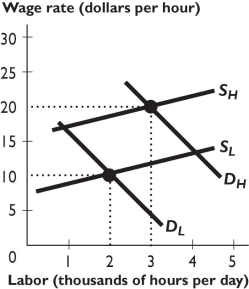
The figure above shows the demand and supply curves for high-skilled (indicated by an "H" subscript) and low-skilled (indicated by an "L" subscript) workers.
-In the figure above,the equilibrium wage differential between high-skilled workers and low-skilled workers is
A) zero.
B) $5.00 or less per hour.
C) between $5.01 and $10.00 per hour.
D) between $10.01 and $20.00 per hour.
E) more than $20.01 per hour.
Correct Answer:
Verified
Q19: What is a Lorenz curve?
Q120: When government redistributes income,one dollar collected from
Q121: The wage differential between high-skilled and low-skilled
Q123: Q124: Q127: Discrimination Q129: Which of the following statements correctly describes Unlock this Answer For Free Now! View this answer and more for free by performing one of the following actions Scan the QR code to install the App and get 2 free unlocks Unlock quizzes for free by uploading documents![]()
![]()
A) can be corrected by imposing a

