The graph shows the activity R as a function of the time t for three radioactive samples. Rank the samples according to their half-lives, shortest to longest. 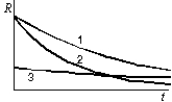
A) 1, 2 ,3
B) 1, 3, 2
C) 2, 1, 3
D) 2, 3, 1
E) 3, 1, 2
Correct Answer:
Verified
Q3: The greatest binding energy per nucleon occurs
Q30: At the end of 14 min, 1/16
Q32: Which expression correctly describes the radioactive decay
Q33: Let A be the mass number and
Q36: Starting with a sample of pure 66Cu,
Q38: Radioactive 90Sr has a half-life of 30
Q39: The half-life of a radioactive substance is:
A)half
Q39: Radioactive element A decays to the stable
Q46: Radioactive polonium, 214Po (Z = 84), decays
Q51: Magnesium has atomic number 12, hydrogen
Unlock this Answer For Free Now!
View this answer and more for free by performing one of the following actions

Scan the QR code to install the App and get 2 free unlocks

Unlock quizzes for free by uploading documents