The graph represents the straight line motion of a car. How far does the car travel between t = 2 seconds and t = 5 seconds? 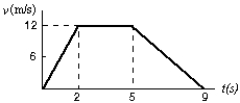
A) 4 m
B) 12 m
C) 24 m
D) 36 m
E) 60 m
Correct Answer:
Verified
Q28: Over a short interval, starting at time
Q40: The diagram shows a velocity-time graph for
Q43: The diagram represents the straight line motion
Q47: At time t = 0 a car
Q49: An object has a constant acceleration of
Q53: At a location where g = 9.80
Q54: A drag racing car starts from rest
Q63: An object is thrown straight up from
Q70: A baseball is thrown vertically into the
Q78: An object is shot vertically upward.While it
Unlock this Answer For Free Now!
View this answer and more for free by performing one of the following actions

Scan the QR code to install the App and get 2 free unlocks

Unlock quizzes for free by uploading documents