The graph shows the decay rate R as a function of the time t for three radioactive samples. Rank the samples according to their half-lives, shortest to longest. 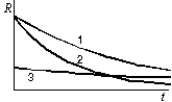
A) 1, 2 ,3
B) 1, 3, 2
C) 2, 1, 3
D) 2, 3, 1
E) 3, 1, 2
Correct Answer:
Verified
Q21: The half-life of a radioactive isotope is
Q24: The relation between the disintegration constant
Q28: The half-life of radium is about 1600
Q31: Two protons are separated by 10-16 m.The
Q32: Radioactive 90Sr has a half-life of 30
Q33: One curie is equivalent to:
A)one Becquerel
B)one decay
Q34: In an alpha decay the disintegration energy
Q36: Which expression correctly describes the radioactive decay
Q38: Radioactive element A decays to the stable
Q40: The half-life of a given nuclear
Unlock this Answer For Free Now!
View this answer and more for free by performing one of the following actions

Scan the QR code to install the App and get 2 free unlocks

Unlock quizzes for free by uploading documents