Consider the following weather map showing the southwestern part of the United States. 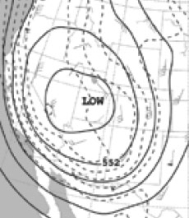 This map seems to indicate that this geographical region:
A) is experiencing barometric pressures greater than 760 mm Hg.
B) that air masses are descending and warming.
C) cloud formation is likely.
D) is experiencing lower than normal temperatures.
E) All of the above are likely to occur in this region in the time frame of this map.
Correct Answer:
Verified
Q7: Which of the following statements are true?
i.One
Q12: Which of the following statements is true?
A)The
Q13: Which of the following statements is false?
A)Gas
Q14: Convert 1.47 atm to psi and in.Hg.
A)0.100
Q15: Examine the barometer shown below. 
Q15: On a day when atmospheric pressure is
Q18: Consider the mercury barometer shown below.
Q19: Convert 13.3 psi to kPa and torr.
A)1.35
Q21: Consider the following graph.The data for
Q53: A gas sample occupies 8.15 volume units
Unlock this Answer For Free Now!
View this answer and more for free by performing one of the following actions

Scan the QR code to install the App and get 2 free unlocks

Unlock quizzes for free by uploading documents