The diagram shows a plot of the potential energy as a function of x for a particle moving along the x axis.The points of stable equilibrium are: 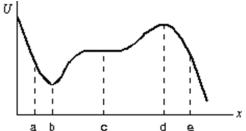
A) only a
B) only b
C) only c
D) only d
E) b and d
Correct Answer:
Verified
Q53: The first graph shows the potential energy
Q54: As a particle moves along the x
Q55: The diagram shows a plot of the
Q56: A stationary mass m = 1.3 kg
Q57: The potential energy of a 0.20-kg particle
Q59: A block is released from rest at
Q60: The potential energy of a particle moving
Q61: The energy of a system increases at
Q62: A 0.75-kg block slides on a rough
Q63: A 25-g ball is released from rest
Unlock this Answer For Free Now!
View this answer and more for free by performing one of the following actions

Scan the QR code to install the App and get 2 free unlocks

Unlock quizzes for free by uploading documents