Figure 17-2 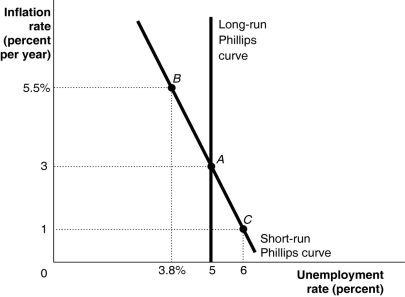
-Refer to Figure 17-2.Suppose the economy is at point C in the figure above.If workers adjust their expectations of inflation,which of the following will be true?
A) The short-run Phillips curve will shift to the right.
B) The short-run Phillips curve will shift to the left.
C) The economy will move from C to A.
D) Workers and firms expect inflation to be 1%.
E) The natural rate of unemployment is 6%.
Correct Answer:
Verified
Q79: Does the short-run Phillips curve have a
Q80: A study conducted by Robert Shiller,a Yale
Q81: Figure 17-2 Q82: Figure 17-2 Q83: The long-run Phillips curve is _ than Q85: Which of the following would increase the Q86: At the point where actual inflation is Q87: If expected inflation rises,the long-run Phillips curve Q88: Figure 17-2 Q89: If workers and firms raise their inflation Unlock this Answer For Free Now! View this answer and more for free by performing one of the following actions Scan the QR code to install the App and get 2 free unlocks Unlock quizzes for free by uploading documents![]()
![]()
![]()

