Multiple Choice
Figure 13-4 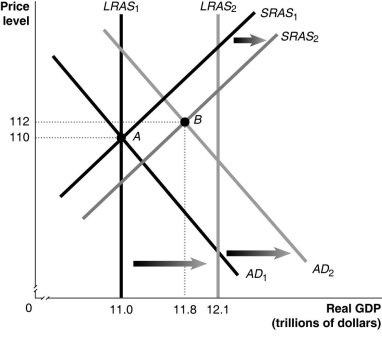
-Refer to Figure 13-4.Given the economy is at point A in year 1,what is the inflation rate between year 1 and year 2?
A) 0.9%
B) 1.8%
C) 2.7%
D) 3.0%
Correct Answer:
Verified
Related Questions
Q226: Which of the following could explain why
Q227: Starting from long-run equilibrium,use the basic aggregate
Q228: Figure 13-4 Q229: Using the aggregate supply and demand model,illustrate![]()
Unlock this Answer For Free Now!
View this answer and more for free by performing one of the following actions

Scan the QR code to install the App and get 2 free unlocks

Unlock quizzes for free by uploading documents