Figure 4-4 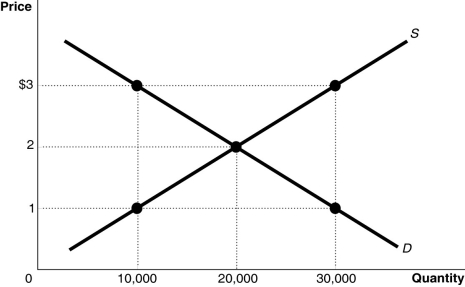
-Refer to Figure 4-4.The figure above represents the market for iced tea.Assume that this is a competitive market.If the price of iced tea is $1
A) the quantity supplied is less than the economically efficient quantity.
B) the quantity supplied is economically efficient but the quantity demanded is economically inefficient.
C) economic surplus is maximized.
D) not enough consumers want to buy iced tea.
Correct Answer:
Verified
Q84: Figure 4-4 Q85: Figure 4-4 Q86: Figure 4-4 Q87: Figure 4-4 Q88: Equilibrium in a competitive market results in Q90: If the market price is at equilibrium,the Q91: The difference between consumer surplus and producer Q92: In a competitive market the _ curve Q93: Figure 4-4 Q94: _ is defined as a market outcome Unlock this Answer For Free Now! View this answer and more for free by performing one of the following actions Scan the QR code to install the App and get 2 free unlocks Unlock quizzes for free by uploading documents![]()
![]()
![]()
![]()
![]()

