This graph depicts the demand for a normal good. 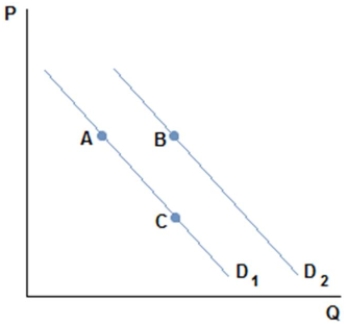 A shift from A to B in the graph shown for a normal good might be caused by:
A) an increase in price.
B) a decrease in price.
C) an increase in income.
D) a decrease in income.
Correct Answer:
Verified
Q61: Demand for Shell gasoline will increase if
Q63: Ray's company just announced that everyone will
Q64: The price of dog collars has gone
Q65: The price of house paint,a normal good,has
Q66: There has been an increase in the
Q75: There has been a decrease in the
Q76: The city of Burlington is a very
Q76: This graph depicts the demand for a
Q77: Darren loves to go to the movies,and
Q78: The city of Burlington gets very hot
Unlock this Answer For Free Now!
View this answer and more for free by performing one of the following actions

Scan the QR code to install the App and get 2 free unlocks

Unlock quizzes for free by uploading documents