Multiple Choice
 According to the graph shown, at a price of $15, there is a:
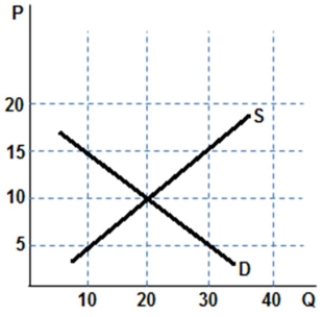
A) shortage of 10.
B) shortage of 20.
C) shortage of 30.
D) surplus of 20.
Correct Answer:
Verified
Related Questions
Q123: Consider a market that is in equilibrium.If
Q141: Q142: Q143: Q146: This table shows the demand and supply Unlock this Answer For Free Now! View this answer and more for free by performing one of the following actions Scan the QR code to install the App and get 2 free unlocks Unlock quizzes for free by uploading documents![]()
![]()
![]()

