The following table shows the annual revenues (in millions of dollars) of a pharmaceutical company over the period 1990-2011. 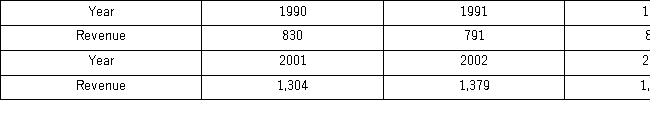
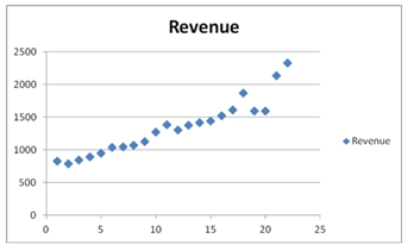 The Excel scatterplot shown indicates that the annual revenues have an increasing trend.Therefore,linear,exponential,quadratic,and cubic models were used to fit the trend,and the following relevant information became available after applying linear regression.
 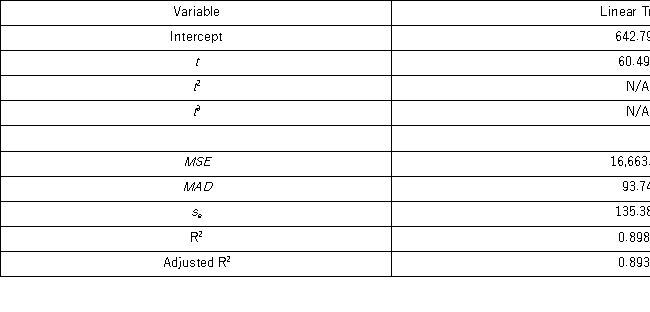 Using the linear trend equation,one can say that the predicted revenue increases by ____________.
A) $642,792,000 a year
B) $604,930,000 a year
C) $60,493,000 a year
D) $6,049,300 a year
Correct Answer:
Verified
Q61: Which of the following is a centered
Q64: When comparing which of the following trend
Q65: Which of the following types of trend
Q70: Which of the following formulas is used
Q72: When a time series is analyzed by
Q73: The following table shows the annual revenues
Q76: In comparison with the linear trend model,
Q78: If the model yt = Tt ×
Q79: The following table shows the annual revenues
Q80: The following table shows the annual revenues
Unlock this Answer For Free Now!
View this answer and more for free by performing one of the following actions

Scan the QR code to install the App and get 2 free unlocks

Unlock quizzes for free by uploading documents