The following table shows the annual revenues (in millions of dollars)of a pharmaceutical company over the period 1990-2011.  The autoregressive models of order 1 and 2,yt = β0 + β1yt - 1 + εt,and yt = β0 + β1yt - 1 + β2yt - 2 + εt,were applied on the time series to make revenue forecasts.The relevant parts of Excel regression outputs are given below.
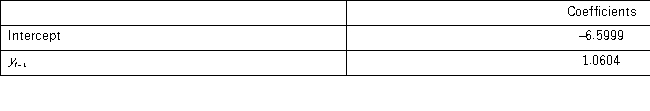
Model AR(1): 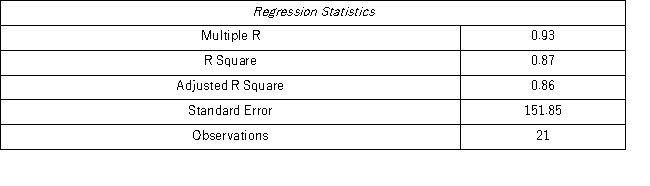
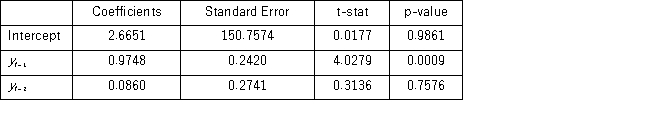
 Model AR(2):
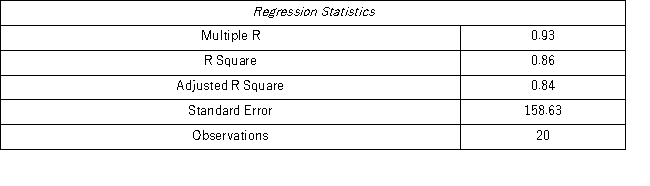
 Using the AR(1)model,find the company revenue forecast for 2012.
Correct Answer:
Verified
View Answer
Unlock this answer now
Get Access to more Verified Answers free of charge
Q101: Quarterly sales of a department store for
Q103: Which of the following equations is a
Q104: Prices of crude oil have been steadily
Q105: If there are T observations (yi,xi)to estimate
Q106: Which of the following models is not
Q107: Prices of crude oil have been steadily
Q108: Quarterly sales of a department store for
Q109: Given the estimated model Q110: Prices of crude oil have been steadily Q111: The following table shows the annual revenues![]()
Unlock this Answer For Free Now!
View this answer and more for free by performing one of the following actions

Scan the QR code to install the App and get 2 free unlocks

Unlock quizzes for free by uploading documents