The following Excel scatterplot with the fitted quadratic regression equation illustrates the observed relationship between productivity and the number of hired workers. 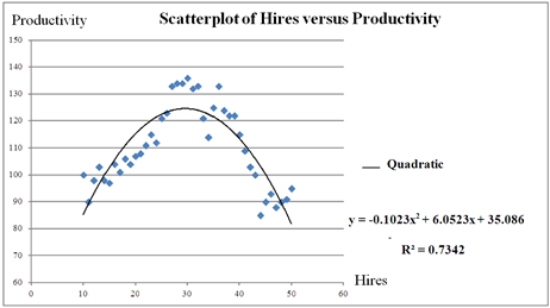 Assuming that the values of Hires can be nonintegers,what is the maximum value of Productivity?
A) 29.58
B) 124.603
C) 35.086
D) 127.50
Correct Answer:
Verified
Q3: For the exponential model ln(y) = β0
Q6: The fit of the models y =
Q21: For the quadratic equation Q22: For the quadratic regression equation Q23: When not all variables are transformed into Q25: The following Excel scatterplot with the fitted Q26: For the quadratic regression equation Q27: The log-log and the _ models can Q28: Although a polynomial regression model of order Q29: To compute the coefficient of determination R2![]()

Unlock this Answer For Free Now!
View this answer and more for free by performing one of the following actions

Scan the QR code to install the App and get 2 free unlocks

Unlock quizzes for free by uploading documents