The following data,with the corresponding Excel scatterplot,show the average growth rate of Weeping Higan cherry trees planted in Washington,DC.At the time of planting,the trees were one year old and were all six feet in height. 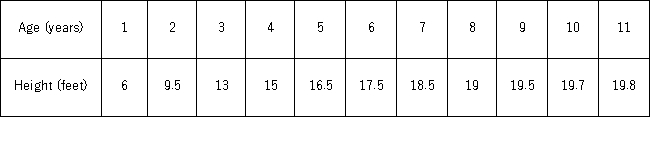
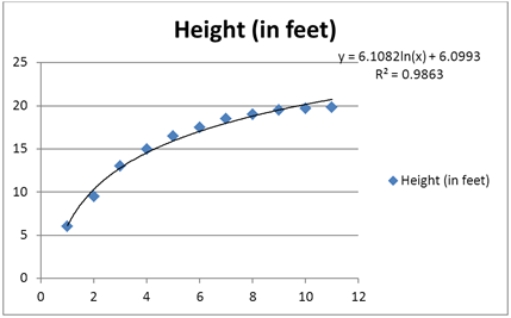 The 98.63% of the variations in Height is explained by _______.
A) Height
B) Age
C) ln(Age)
D) ln(Height)
Correct Answer:
Verified
Q59: In the model ln(y) = β0 +
Q68: Which of the following regression models is
Q69: The linear and logarithmic models,y = β0
Q70: The following data,with the corresponding Excel scatterplot,show
Q71: The following data,with the corresponding Excel scatterplot,show
Q72: Which of the following regression models is
Q74: The following data,with the corresponding Excel scatterplot,show
Q75: A model in which both the response
Q77: The following data show the demand for
Q78: The log-log and exponential models,ln(x)= β0 +
Unlock this Answer For Free Now!
View this answer and more for free by performing one of the following actions

Scan the QR code to install the App and get 2 free unlocks

Unlock quizzes for free by uploading documents