In the following table,individuals are cross-classified by their age group and income level. 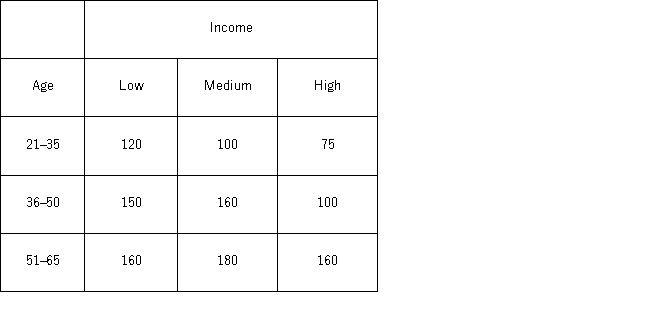 Using the p-value approach and α = 0.05,the decision and conclusion are __________________________________.
A) do not reject the null hypothesis;age and income are dependent
B) do not reject the null hypothesis;age and income are independent
C) reject the null hypothesis;age and income are dependent
D) reject the null hypothesis;age and income are independent
Correct Answer:
Verified
Q65: In the following table,individuals are cross-classified by
Q66: The following table shows the distribution of
Q67: The following table shows the distribution of
Q68: In the following table,individuals are cross-classified by
Q69: The following table shows the distribution of
Q71: The following table shows the distribution of
Q72: The following table shows the distribution of
Q73: The heights (in cm)for a random sample
Q74: The following table shows the distribution of
Q75: In the following table,individuals are cross-classified by
Unlock this Answer For Free Now!
View this answer and more for free by performing one of the following actions

Scan the QR code to install the App and get 2 free unlocks

Unlock quizzes for free by uploading documents