The following table shows the observed frequencies of the quarterly returns for a sample of 60 hedge funds.The table also contains the hypothesized proportions of each class assuming the quarterly returns have a normal distribution.The sample mean and standard deviation are 3.6% and 7.4% respectively. 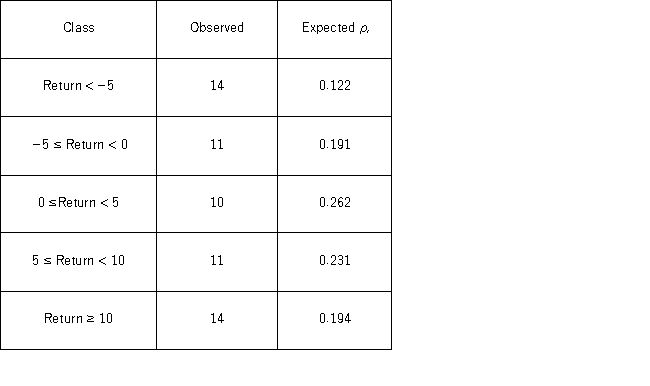 a.Set up the competing hypotheses for the goodness-of-fit test of normality for the quarterly returns.
b.Calculate the value of the test statistic and determine the degrees of freedom.
c.Compute the p-value.Does the evidence suggest that the quarterly returns do not have a normal distribution at the 10% significance level?
Correct Answer:
Verified
View Answer
Unlock this answer now
Get Access to more Verified Answers free of charge
Q107: The following frequency distribution shows the monthly
Q108: Suppose Bank of America would like to
Q109: The following table shows numerical summaries of
Q110: The following table shows the cross-classification of
Q111: A researcher wants to verify his belief
Q113: The following table shows the observed frequencies
Q115: MARS claims that Skittles candies should be
Q115: The following table shows the cross-classification of
Q116: The following frequency distribution shows the monthly
Q117: The following frequency distribution shows the monthly
Unlock this Answer For Free Now!
View this answer and more for free by performing one of the following actions

Scan the QR code to install the App and get 2 free unlocks

Unlock quizzes for free by uploading documents