The following data represents the number of unique visitors and the revenue a website generated for the months of July through December. 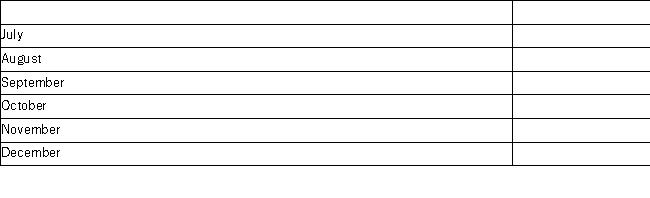 a.What is the sample standard deviation for the number of unique visitors and the revenue?
b.Calculate the coefficient of variations.Which variable has a higher relative dispersion?
c.Calculate the sample correlation coefficient between the number of unique visitors and Revenue.
d.Comment on the strength of the linear relationship.What does this mean for the owner of the website?
Correct Answer:
Verified
View Answer
Unlock this answer now
Get Access to more Verified Answers free of charge
Q136: The following is return data for a
Q137: John lives in Los Angeles and hates
Q138: The Yearly Prices (rounded to the nearest
Q139: The following are daily returns for the
Q140: The following is a list of the
Q142: The following is data a veterinarian collected
Q143: A surfer visited his favorite beach 50
Q144: A luxury apartment complex in South Beach
Q145: A large city in Southern California collected
Q146: Yearly returns (rounded to the nearest percent)for
Unlock this Answer For Free Now!
View this answer and more for free by performing one of the following actions

Scan the QR code to install the App and get 2 free unlocks

Unlock quizzes for free by uploading documents