To approximate the width of a class in the creation of a bar chart,we may use this formula: 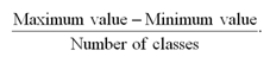
Correct Answer:
Verified
Q1: In order to summarize qualitative data, a
Q2: A bar chart depicts the frequency or
Q5: The percent frequency of a category equals
Q9: Scatterplot is a graphical tool that is
Q10: When constructing a pie chart, only a
Q12: A pie chart is a segmented circle
Q15: An ogive is a graph that plots
Q17: A bar chart may be displayed horizontally.
Q19: A frequency distribution for qualitative data groups
Q20: A polygon connects a series of neighboring
Unlock this Answer For Free Now!
View this answer and more for free by performing one of the following actions

Scan the QR code to install the App and get 2 free unlocks

Unlock quizzes for free by uploading documents