Thirty students at Eastside High School took the SAT on the same Saturday.Their raw scores are given next. 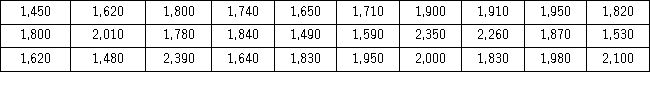 Consider a frequency distribution of the data that groups the data in classes of 1400 up to 1600,1600 up to 1800,1800 up to 2000,and so on.What graphical tool would you use to display the cumulative relative frequency of the grouped data?
A) Ogive
B) Polygon
C) Pie chart
D) Bar chart
Correct Answer:
Verified
Q49: Consider the following frequency distribution. 
Q50: Consider the following frequency distribution.
Q51: Thirty students at Eastside High School took
Q52: Thirty students at Eastside High School took
Q53: An analyst constructed the following frequency distribution
Q55: The following data represent the recent sales
Q56: An analyst constructed the following frequency distribution
Q57: The following histogram represents the number of
Q58: An analyst constructed the following frequency distribution
Q59: Consider the following frequency distribution.
Unlock this Answer For Free Now!
View this answer and more for free by performing one of the following actions

Scan the QR code to install the App and get 2 free unlocks

Unlock quizzes for free by uploading documents