The following figure introduces the relationship between industrial production and wholesale price index changes between the years 1929-1935. What is the purpose of the following figure? 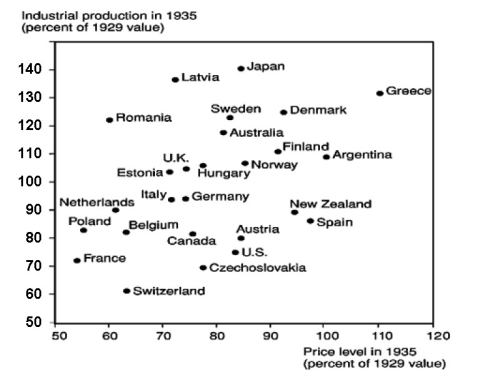
Correct Answer:
Verified
View Answer
Unlock this answer now
Get Access to more Verified Answers free of charge
Q6: The costs of inflation have been most
Q13: The costs of inflation have been most
Q41: What explains the nearly universal scope of
Q42: A country is said to be in
Q48: The dollar of the United States became
Q55: In L. Frank Baum's classic 1900 children's
Q59: Which of the two features of the
Q66: Discuss the impact of the restoration of
Q75: What is a convertible currency?
Q77: Explain how a country with a current
Unlock this Answer For Free Now!
View this answer and more for free by performing one of the following actions

Scan the QR code to install the App and get 2 free unlocks

Unlock quizzes for free by uploading documents