A few years ago the news magazine The Economist listed some of the stranger explanations used in the past to predict presidential election outcomes.These included whether or not the hemlines of women's skirts went up or down,stock market performances,baseball World Series wins by an American League team,etc.Thinking about this problem more seriously,you decide to analyze whether or not the presidential candidate for a certain party did better if his party controlled the house.Accordingly you collect data for the last 34 presidential elections.You think of this data as comprising a population which you want to describe,rather than a sample from which you want to infer behavior of a larger population.You generate the accompanying table:
Joint Distribution of Presidential Party Affiliation and Party Control
of House of Representatives,1860-1996
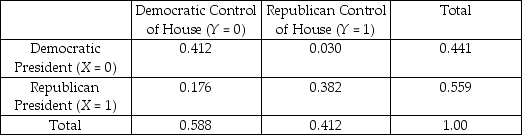 (a)Interpret one of the joint probabilities and one of the marginal probabilities.
(b)Compute E(X).How does this differ from E(X  = 0)? Explain.
(c)If you picked one of the Republican presidents at random,what is the probability that during his term the Democrats had control of the House?
(d)What would the joint distribution look like under independence? Check your results by calculating the two conditional distributions and compare these to the marginal distribution.
Correct Answer:
Verified
View Answer
Unlock this answer now
Get Access to more Verified Answers free of charge
Q43: Think of an example involving five possible
Q44: Calculate the following probabilities using the standard
Q46: The expectations augmented Phillips curve postulates
△p =
Q48: You are at a college of roughly
Q49: In considering the purchase of a certain
Q50: The accompanying table shows the joint distribution
Q51: What would the correlation coefficient be if
Q52: The height of male students at your
Q52: Find the following probabilities:
(a)Y is distributed
Q55: Two random variables are independently distributed if
Unlock this Answer For Free Now!
View this answer and more for free by performing one of the following actions

Scan the QR code to install the App and get 2 free unlocks

Unlock quizzes for free by uploading documents