SAT scores in Mathematics are normally distributed with a mean of 500 and a standard deviation of 100.The formula for the normal distribution is 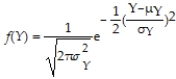 .Use the scatter plot option in a standard spreadsheet program,such as Excel,to plot the Mathematics SAT distribution using this formula.Start by entering 300 as the first SAT score in the first column (the lowest score you can get in the mathematics section as long as you fill in your name correctly),and then increment the scores by 10 until you reach 800.In the second column,use the formula for the normal distribution and calculate f(Y).Then use the scatter plot option,where you eventually remove markers and substitute these with the solid line option.
Correct Answer:
Verified
Q51: The systolic blood pressure of females in
Q57: Following Alfred Nobel's will,there are five Nobel
Q57: Use the definition for the conditional distribution
Q58: The table accompanying lists the joint distribution
Q59: From the Stock and Watson (http://www.pearsonhighered.com/stock_watson)website the
Q62: The accompanying table gives the outcomes and
Q63: The textbook mentioned that the mean of
Q64: The textbook formula for the variance of
Q65: Use a standard spreadsheet program,such as Excel,to
Q66: Looking at a large CPS data set
Unlock this Answer For Free Now!
View this answer and more for free by performing one of the following actions

Scan the QR code to install the App and get 2 free unlocks

Unlock quizzes for free by uploading documents