You have collected quarterly Canadian data on the unemployment and the inflation rate from 1962:I to 2001:IV.You want to re-estimate the ADL(3,1)formulation of the Phillips curve using a GARCH(1,1)specification.The results are as follows:  t = 1.17 - .56 ΔInft-1 - .47 ΔInft-2 - .31 ΔInft-3 - .13 Unempt-1
(.48)(.08)(.10)(.09)(.06)  = .86 + .27
  + .53
+ .53  .
.
(.40)(.11)(.15)
(a)Test the two coefficients for  and
and  in the GARCH model individually for statistical significance.
(b)Estimating the same equation by OLS results in  t = 1.19 - .51 ΔInft-1 - .47 ΔInft-2 - .28 ΔInft-3 - .16Unempt-1
(.54)(.10)(.11)(.08)(.07)
Briefly compare the estimates.Which of the two methods do you prefer?
(c)Given your results from the test in (a),what can you say about the variance of the error terms in the Phillips Curve for Canada?
(d)The following figure plots the residuals along with bands of plus or minus one predicted standard deviation (that is,±  )based on the GARCH(1,1)model.
 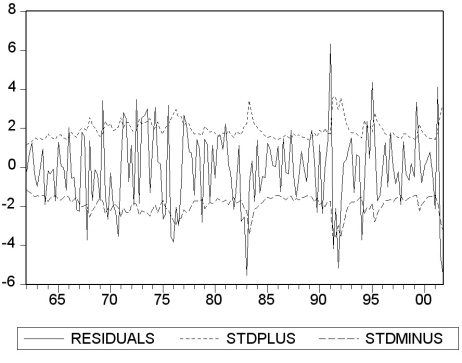 Describe what you see.
Correct Answer:
Verified
View Answer
Unlock this answer now
Get Access to more Verified Answers free of charge
Q21: Think of at least five examples from
Q26: A VAR with k time series variables
Q28: The BIC for the VAR is
A)BIC(p)= ln[det
Q29: Some macroeconomic theories suggest that there is
Q31: Purchasing power parity (PPP),postulates that the exchange
Q31: ARCH and GARCH models are estimated using
Unlock this Answer For Free Now!
View this answer and more for free by performing one of the following actions

Scan the QR code to install the App and get 2 free unlocks

Unlock quizzes for free by uploading documents