To analyze the year-to-year variation in temperature data for a given city,you regress the daily high temperature (Temp)for 100 randomly selected days in two consecutive years (1997 and 1998)for Phoenix.The results are (heteroskedastic-robust standard errors in parenthesis):  = 15.63 + 0.80 ×
  ;R2= 0.65,SER = 9.63
(0.10)
(a)Calculate the predicted temperature for the current year if the temperature in the previous year was 40°F,78°F,and 100°F.How does this compare with you prior expectation? Sketch the regression line and compare it to the 45 degree line.What are the implications?
(b)You recall having studied errors-in-variables before.Although the web site you received your data from seems quite reliable in measuring data accurately,what if the temperature contained measurement error in the following sense: for any given day,say January 28,there is a true underlying seasonal temperature (X),but each year there are different temporary weather patterns (v,w)which result in a temperature  different from X.For the two years in your data set,the situation can be described as follows:
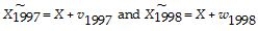
 Hence the population parameter for the intercept and slope are zero and one,as expected.It is not difficult to show that the OLS estimator for the slope is inconsistent,where
 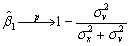 As a result you consider estimating the slope and intercept by TSLS.You think about an instrument and consider the temperature one month ahead of the observation in the previous year.Discuss instrument validity for this case.
(c)The TSLS estimation result is as follows:  = -6.24 + 1.07×
  ;
;
(0.06)
Perform a t-test on whether or not the slope is now significantly different from one.
Correct Answer:
Verified
View Answer
Unlock this answer now
Get Access to more Verified Answers free of charge
Q16: The reduced form equation for X
A)regresses the
Q22: To calculate the J-statistic you regress the
A)squared
Q23: For W to be an effective control
Q24: Describe the consequences of estimating an equation
Q26: Write an essay about where valid instruments
Q27: Instrumental Variables regression uses instruments to
A)establish the
Q29: Consider the following two equations to describe
Q32: Studies of the effect of minimum wages
Q39: In the case of exact identification
A)you can
Q40: Using some of the examples from your
Unlock this Answer For Free Now!
View this answer and more for free by performing one of the following actions

Scan the QR code to install the App and get 2 free unlocks

Unlock quizzes for free by uploading documents