The following histogram shows the distribution of 1000 sample observations from a population with a mean of = 4 and a variance of 2 = 8. 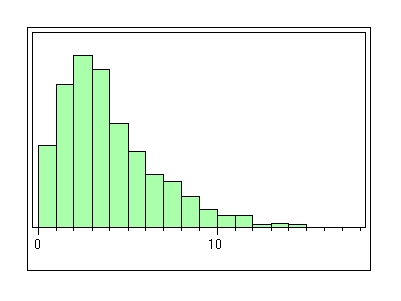 Suppose a simple random sample of 100 observations is to be selected from the population and the sample average
  is calculated.Which of the following statements about the distribution of
  is/are FALSE?
A) The distribution of  will have a mean of 4.
B) The distribution  will be approximately Normal.
C) Because the distribution shown in the histogram above is clearly skewed to the right,the shape of the distribution of  will also show skewness to the right.
D) Even though the distribution of the population variable appears to be skewed to the right,the distribution of  will be approximately symmetric around = 4.
E) The standard deviation of the distribution of  will be 0.283.
Correct Answer:
Verified
Q39: Binomial distributions represent _ random variables.
A)discrete
B)continuous
C)None of
Q40: A researcher is planning to carry out
Q41: A population variable has a distribution
Q42: In the construction industry,compressive strength of
Q43: The length of time it takes
Q45: Chocolate bars produced by a certain machine
Q46: The weights of medium oranges packaged by
Q47: Chocolate bars produced by a certain machine
Q48: Let X represent the SAT total score
Q49: Let X represent the SAT total score
Unlock this Answer For Free Now!
View this answer and more for free by performing one of the following actions

Scan the QR code to install the App and get 2 free unlocks

Unlock quizzes for free by uploading documents