The data below represent the means from 15 sample control charts for the amount of time in minutes it takes students to complete a quiz in a basic statistics course.The same quiz was given to 15 different sections of a basic statistics course.Five students were sampled from each class and each mean is shown below. 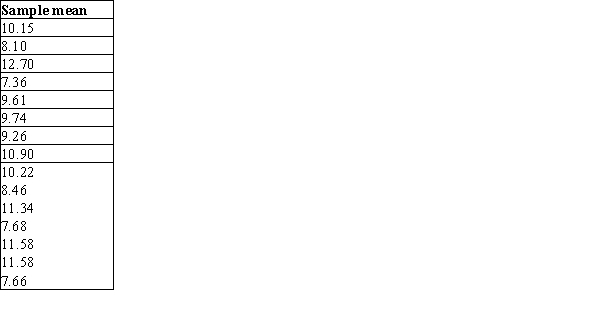 Which graph is the control chart for
  ?
?
A) 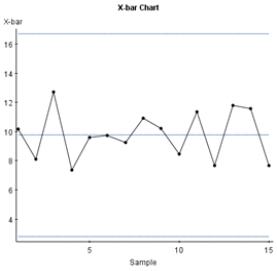
B) 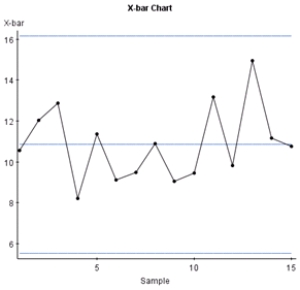
C) 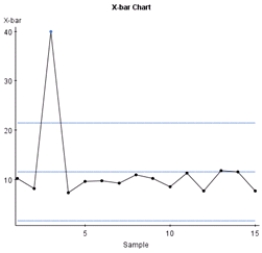
D) None of the above
Correct Answer:
Verified
Q30: You have been invited to give a
Q31: What condition is necessary for a process
Q32: Which of the following is true about
Q33: Which rule will typically signal an out-of-control
Q34: Which of the following is an example
Q36: Why is statistical control necessary?
A)If a process
Q37: What do R charts measure?
A)The spread based
Q38: Which of the control charts is out
Q39: The data below represent the means from
Q40: Which of the control charts is in
Unlock this Answer For Free Now!
View this answer and more for free by performing one of the following actions

Scan the QR code to install the App and get 2 free unlocks

Unlock quizzes for free by uploading documents