The mayor of Beltsville has commissioned a research company to estimate the average age of the houses in a large historical district in the town.Data on 120 randomly selected properties are collected,and a histogram of the sample data shows a right-skewed distribution with several large outliers.The person leading this project decides that the standard t procedures should not be used.He decides to use the 25% trimmed mean as a measure of center.The leader of the project then decides to bootstrap the 25% trimmed mean.The bootstrap distribution is shown below.Some summary measures are given as well. 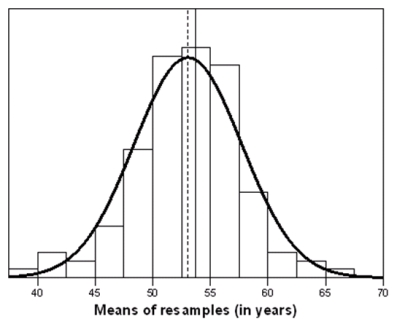 Number of Replications: 500
Summary Statistics:
Observed Mean Bias SE
TrimMean 53.675 53.05 4.67
Percentiles:
2.5% 5% 25% 50% 75% 95% 97.5%
TrimMean 41.05 44.28 50.45 53.20 56.05 60.80 63.82
The dashed line in the histogram represents the mean of the resamples.The solid line represents the observed value of the trimmed mean in the original sample.
As part of the summary measure,the value 4.67 is reported as the SE.How was this value calculated,and what does it represent?
Correct Answer:
Verified
View Answer
Unlock this answer now
Get Access to more Verified Answers free of charge
Q32: Which of the following statements about permutation
Q33: Is the bootstrap distribution from a very
Q34: In which of the following situations can
Q35: A consumer advocate is comparing income for
Q36: A large simple random sample is
Q37: What is the main advantage of using
Q38: A consumer advocate is comparing income for
Q39: How do we calculate the P-value for
Q40: Variation in bootstrap distributions is largely based
Q42: A real estate agency with property all
Unlock this Answer For Free Now!
View this answer and more for free by performing one of the following actions

Scan the QR code to install the App and get 2 free unlocks

Unlock quizzes for free by uploading documents