Independent random samples of households in the four U.S.regions (Northeast,Midwest,South,and West)yielded data on last year's energy consumption.We are interested in assessing,at the 1% significance level,if the data provide sufficient evidence to conclude that last year's average energy consumption was different among the four U.S.regions.Assume that energy consumption in the four regions is Normally distributed.
SPSS was used to create the side-by-side boxplots shown below. 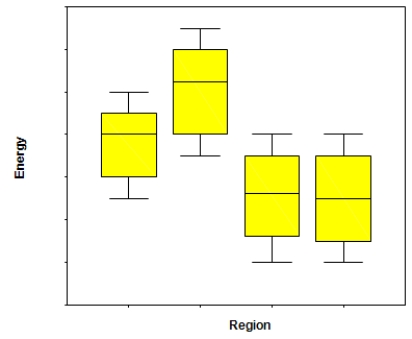 What assumption needed for an ANOVA F test can be checked with this graph?
Correct Answer:
Verified
View Answer
Unlock this answer now
Get Access to more Verified Answers free of charge
Q61: At a large automobile factory,four different machines
Q62: A service center for electronic equipment
Q63: At a large automobile factory,four different
Q64: At a large automobile factory,four different machines
Q65: Independent random samples of households in the
Q67: At a large automobile factory,four different
Q68: A service center for electronic equipment
Q69: A service center for electronic equipment
Q70: At a large automobile factory,four different machines
Q71: At a large automobile factory,four different machines
Unlock this Answer For Free Now!
View this answer and more for free by performing one of the following actions

Scan the QR code to install the App and get 2 free unlocks

Unlock quizzes for free by uploading documents