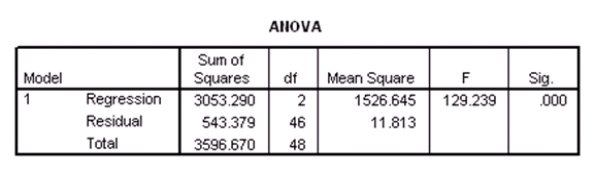
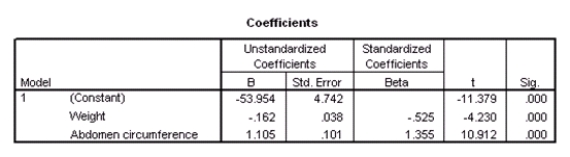
Researchers at a large nutrition and weight management company are trying to build a model to predict a person's body fat percentage from an array of variables such as body weight,height,and body measurements around the neck,chest,abdomen,hips,biceps,etc.A variable selection method is used to build a simple model.SPSS output for the final model is given below. 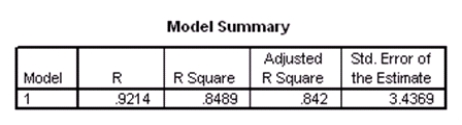
 A graph of the residuals versus the predicted values is given below.
 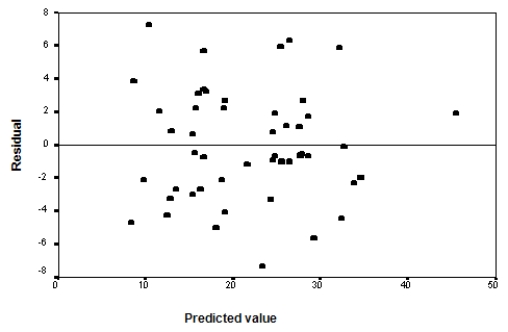 What assumption do we check with this graph?
A) The Normality of the error terms
B) The independence of the residuals
C) The constant variance assumption of the predicted values
D) None of the above
Correct Answer:
Verified
Q16: The data referred to in this question
Q17: The data referred to in this question
Q18: A researcher is investigating possible explanations
Q19: The data referred to in this
Q20: The data referred to in this question
Q22: A researcher is investigating variables that
Q23: Researchers at a car resale company are
Q24: Based on a sample of the salaries
Q25: A researcher is investigating variables that
Q26: A researcher is investigating variables that
Unlock this Answer For Free Now!
View this answer and more for free by performing one of the following actions

Scan the QR code to install the App and get 2 free unlocks

Unlock quizzes for free by uploading documents