As in most professional sports,statistics are collected in the National Hockey League.In the 2006-2007 season,teams played 82 games.A team was awarded 2 points for a win and 1 point if the game was tied at the end of regulation time but then lost in overtime.For each of the 30 teams,data on the number of goals scored per game (Goals/G) and the percentage of the 164 possible points they won (Win%) during the season were collected.The following graph shows the plotted points for the variables Win% and Goals/G and the simple linear regression line fitted using least squares. 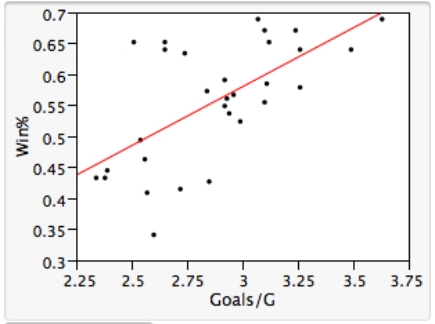 From the computer output for the least-squares fit,the estimated equation was found to be
  ,
,  = 0.398,and
  = 60.29.Also,it was determined from the output that
  = 12.800 and
  = 4.418. Which of the following statements is/are FALSE?
A) An amount of 39.8% of the variation in the winning percent variable is explained by the least-squares regression on the number of goals scored per game.
B) An increase of 1 goal per game results in an increase of about 19% in winning percent.
C) If a team scores 3 goals per game,we would predict the team would have a Win% of 55%.
D) The Ottawa Senators scored 3.49 goals per game and their Win% was 64.0.The residual for Ottawa was then -3.32.
E) The mean value of the Win% variable is 0.932 when the Goals/G is 0.
Correct Answer:
Verified
Q19: The data referred to in this question
Q20: The data referred to in this question
Q21: The statistical model for simple linear
Q22: A random sample of 79 companies from
Q23: A random sample of 79 companies from
Q25: A random sample of 79 companies
Q26: A random sample of 79 companies
Q27: A random sample of 79 companies
Q28: The statistical model for simple linear
Q29: A random sample of 79 companies from
Unlock this Answer For Free Now!
View this answer and more for free by performing one of the following actions

Scan the QR code to install the App and get 2 free unlocks

Unlock quizzes for free by uploading documents