As in most professional sports,statistics are collected in the National Hockey League.In the 2006-2007 season,teams played 82 games.A team was awarded 2 points for a win and 1 point if the game was tied at the end of regulation time but then lost in overtime.For each of the 30 teams,data on the number of goals scored per game (Goals/G) and the percentage of the 164 possible points they won (Win%) during the season were collected.The following graph shows the plotted points for the variables Win% and Goals/G and the simple linear regression line fitted using least squares. 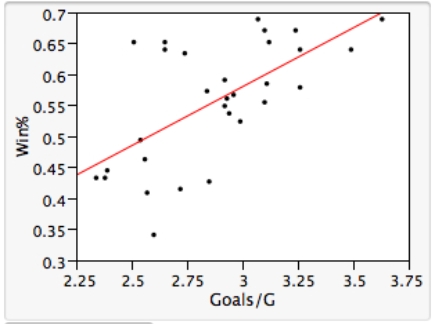 From the computer output for the least-squares fit,the estimated equation was found to be
 = 0.398,and
  = 60.29.Also,it was determined from the output that
  = 12.800 and
  = 4.418.For the 2006-2007 season,teams scored an average of
  = 2.88 goals per game.For the population of teams that score 2.5 goals per game,the standard error of the estimated mean Win% is
  = 2.197.What is the estimated mean Win% for the population of teams that score 2.5 goals per game?
A) 42.7%
B) 53.6%
C) 48.5%
D) 55.7%
E) Not within ± 2% of any of the above
Correct Answer:
Verified
Q28: The statistical model for simple linear
Q29: A random sample of 79 companies from
Q30: As in most professional sports,statistics are
Q31: Do heavier cars use more gasoline?
Q32: A random sample of 79 companies from
Q34: A random sample of 79 companies from
Q35: A random sample of 79 companies from
Q36: The statistical model for simple linear
Q37: As in most professional sports,statistics are collected
Q38: As in most professional sports,statistics are collected
Unlock this Answer For Free Now!
View this answer and more for free by performing one of the following actions

Scan the QR code to install the App and get 2 free unlocks

Unlock quizzes for free by uploading documents