The following scatter plot and SPSS output represent data collected on 89 middle-aged people.The relationship between body weight and percent body fat is to be studied. 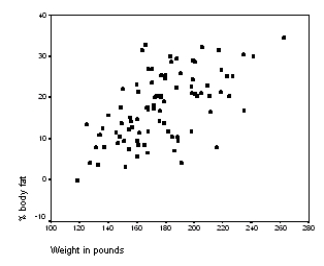
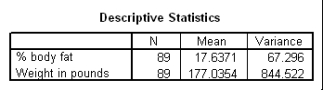
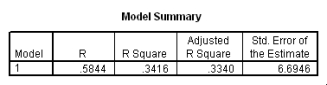
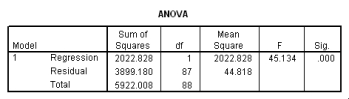
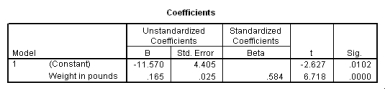 What is the equation of the least-squares regression line?
Correct Answer:
Verified
Q57: Suppose we are given the following information:
Q58: Prediction intervals are usually wider,narrower,or the same
Q59: A recent study was done to assess
Q60: A recent study was done to assess
Q61: The following scatter plot and SPSS
Q63: A study was conducted to monitor the
Q64: The following scatter plot and SPSS
Q65: In the National Football League (NFL),having
Q66: In the National Football League (NFL),having an
Q67: A recent study was done to assess
Unlock this Answer For Free Now!
View this answer and more for free by performing one of the following actions

Scan the QR code to install the App and get 2 free unlocks

Unlock quizzes for free by uploading documents