The timeplot below gives the number of burglaries committed each month for a city in Ohio.The plot is for the three-year period of January 1987 to December 1989. 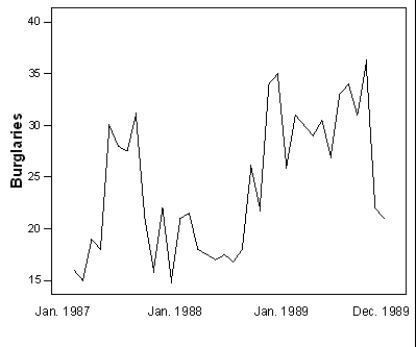 What is approximately the number of burglaries in December 1989,the last date recorded in the timeplot?
A) 22
B) 27
C) 32
D) 37
Correct Answer:
Verified
Q53: A consumer agency is testing appliances for
Q54: The histogram below represents the height (in
Q55: When displaying the distribution of quantitative data,it
Q56: The histogram below represents the height (in
Q57: A study is being conducted on air
Q59: When drawing a histogram,it is important to
A)have
Q60: The pie chart provides information on all
Q61: The World Malaria Report (2008)has information on
Q62: The World Malaria Report (2008)has information on
Q63: Malaria is a leading cause of infectious
Unlock this Answer For Free Now!
View this answer and more for free by performing one of the following actions

Scan the QR code to install the App and get 2 free unlocks

Unlock quizzes for free by uploading documents