Malaria is a leading cause of infectious disease and death worldwide.The table below represents the mean number of reported malaria cases (between 1996 and 2006) for each of 10 West African countries,as published in the journal Statistica Neerlandica in 2010. 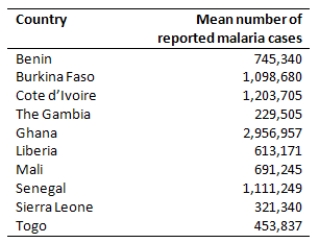 What is the best method to display these data?
A) Histogram
B) Pie chart
C) Bar graph
D) Stem-and-leaf plot
Correct Answer:
Verified
Q58: The timeplot below gives the number of
Q59: When drawing a histogram,it is important to
A)have
Q60: The pie chart provides information on all
Q61: The World Malaria Report (2008)has information on
Q62: The World Malaria Report (2008)has information on
Q64: The World Malaria Report (2008)has information on
Q65: Which of the following variables is categorical?
A)The
Q66: Malaria is a leading cause of infectious
Q67: A study of 2007 model automobiles was
Q68: When examining a distribution of a quantitative
Unlock this Answer For Free Now!
View this answer and more for free by performing one of the following actions

Scan the QR code to install the App and get 2 free unlocks

Unlock quizzes for free by uploading documents