Malaria is a leading cause of infectious disease and death worldwide.The table below represents the mean number of reported malaria cases (between 1996 and 2006)for each of 10 West African countries,as published in the journal Statistica Neerlandica in 2010. 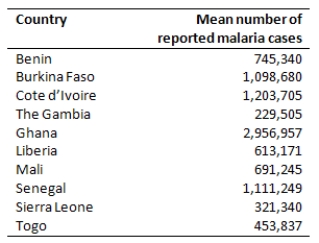 True or False.Making a histogram of the data would tell us if the distribution of the malaria data is symmetric.
Correct Answer:
Verified
Q75: In the fuel efficiency study of 2007
Q76: The World Malaria Report (2008)has information on
Q77: The following stemplot displays the number of
Q78: Malaria is a leading cause of infectious
Q79: According to the American Cancer Society,the decline
Q81: As part of a large ongoing study
Q82: The bar graph below represents the highest
Q83: A nationwide study was done to assess
Q84: The bar graph below represents the highest
Q85: The bar graph below represents the highest
Unlock this Answer For Free Now!
View this answer and more for free by performing one of the following actions

Scan the QR code to install the App and get 2 free unlocks

Unlock quizzes for free by uploading documents